
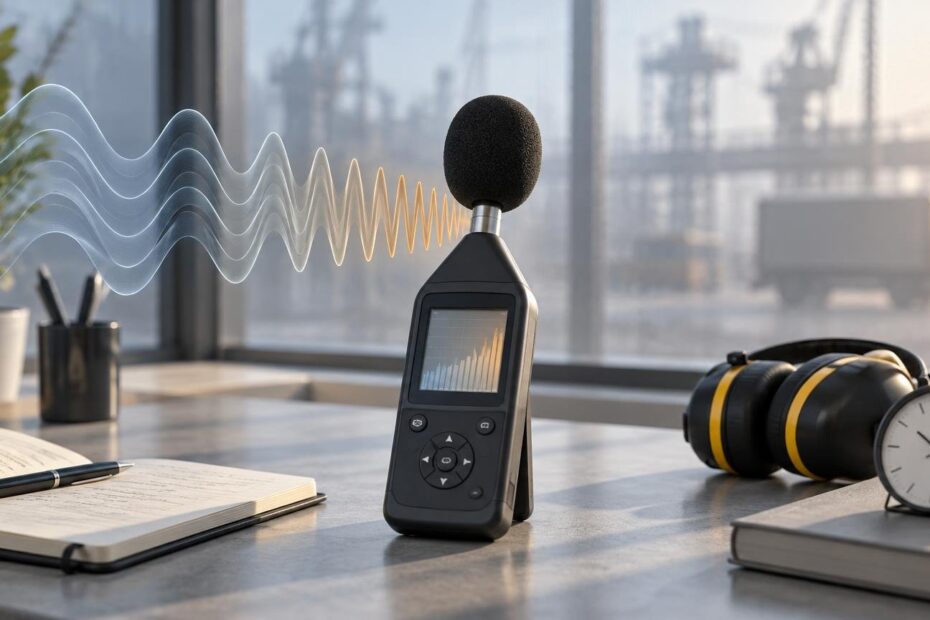
Noise Exposure Data: Decibels, Time Weighting, and Why 3 dB Is a Big Change
A 3 dB increase roughly doubles sound energy, but interpreting noise exposure also requires duration, weighting, measurement method and the applicable exposure model.
A 3 dB increase roughly doubles sound energy, but interpreting noise exposure also requires duration, weighting, measurement method and the applicable exposure model.
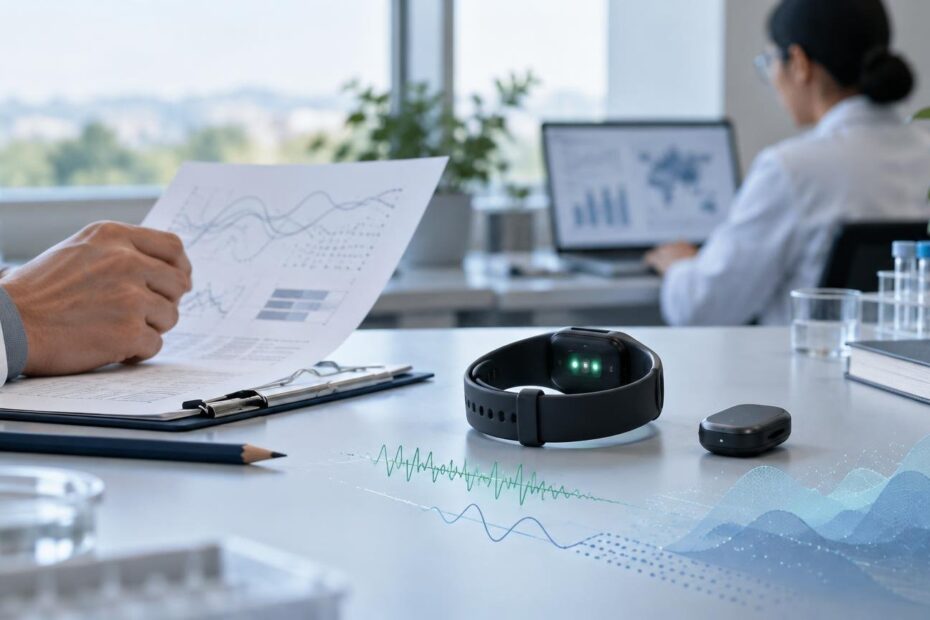
Wearables measure optical and motion signals, but most familiar outputs—including sleep stages, calories and sometimes HRV—are algorithmic estimates. Here is how to interpret them.

Age adjustment separates differences in age structure from differences in age-specific health rates. It improves comparisons, but crude rates remain essential for measuring actual burden.

A p-value below 0.05 becomes much less surprising when researchers test dozens of outcomes, time points, or subgroups. Here is how multiplicity changes the evidence—and how to recognize findings that need confirmation.
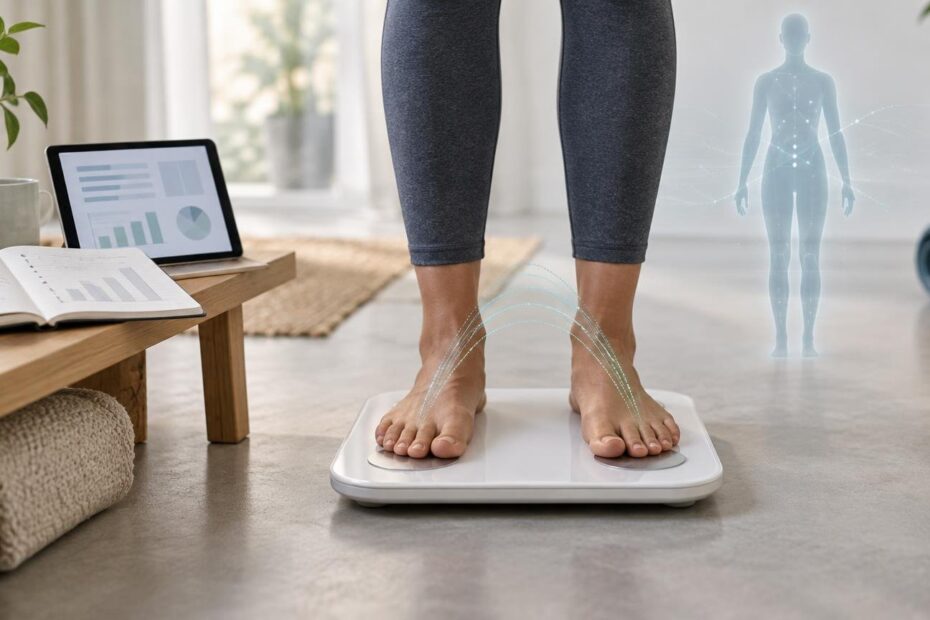
Smart scales can measure weight accurately while producing much less certain body-fat estimates. Here is how impedance, hydration, equations and measurement conditions affect the result.
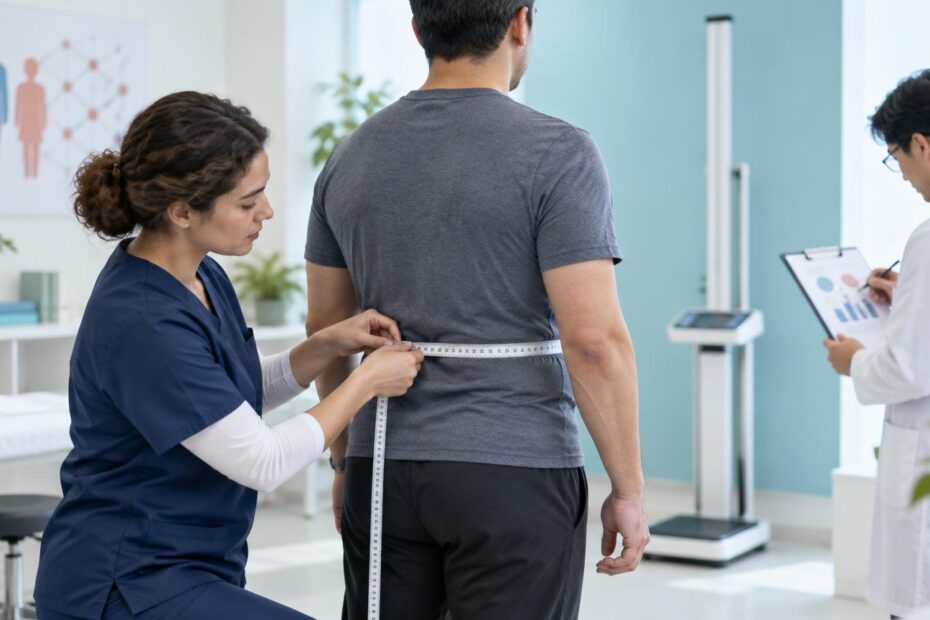
BMI offers a simple measure of weight relative to height, while waist circumference adds information about abdominal fat distribution. Here is why metabolic-risk studies often use both.
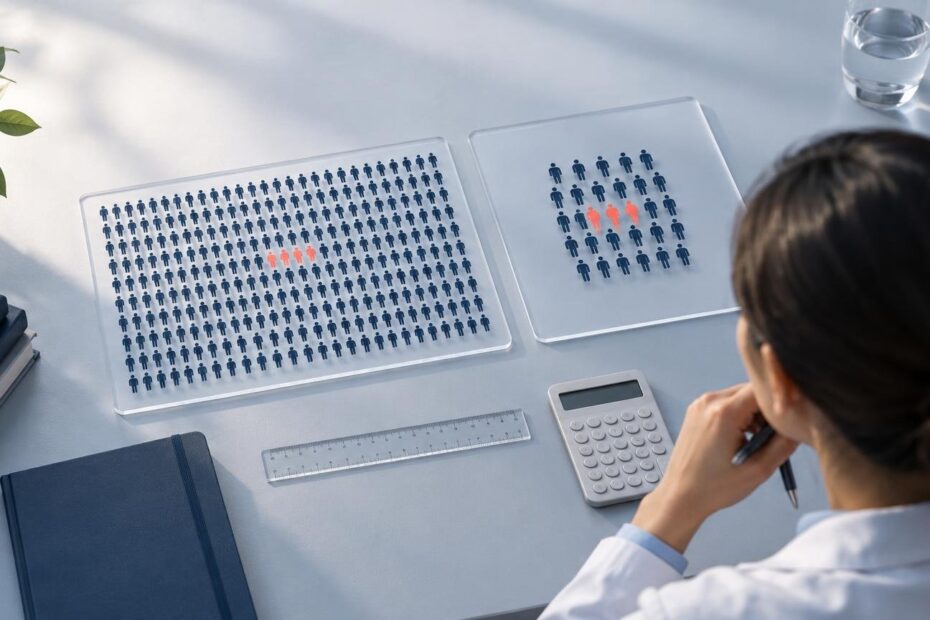
A per-100,000 figure can often be converted to a percentage with simple arithmetic. Correct interpretation also requires checking the population, timeframe, event definition, and type of rate.
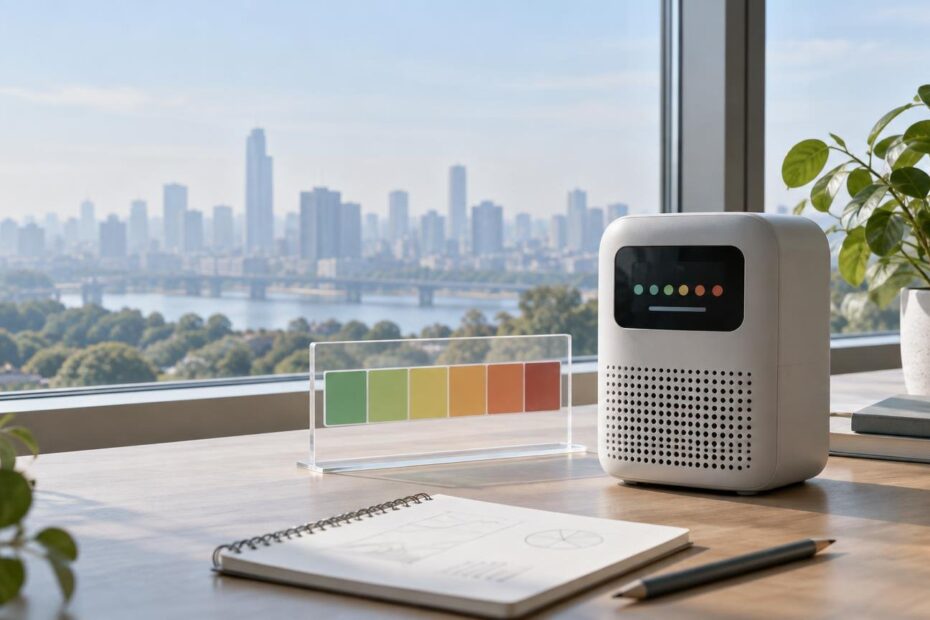
PM2.5 is a pollutant concentration, while AQI is a health-communication index calculated from pollution data. Here is how the U.S. system connects them.
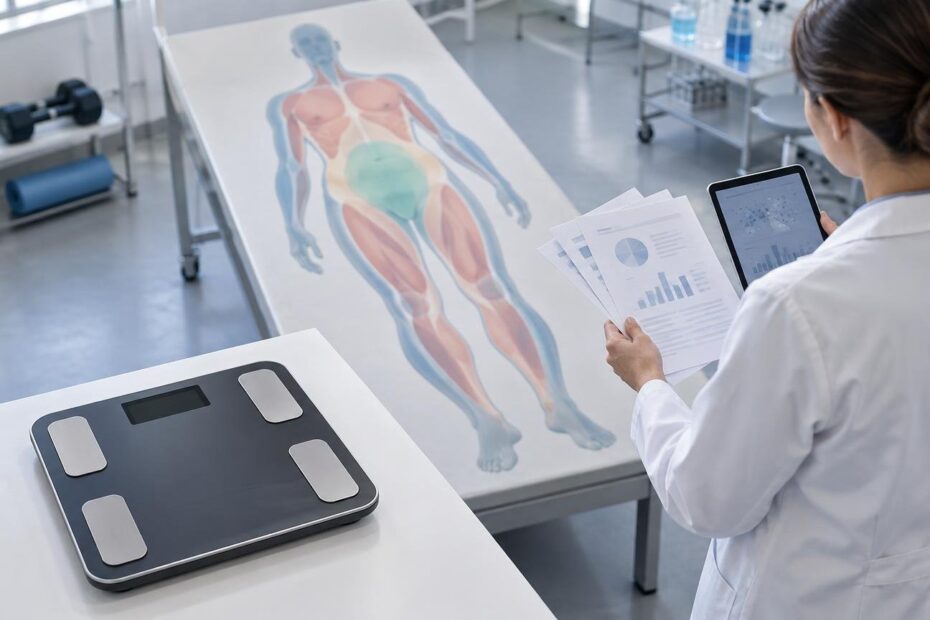
Scale weight cannot show which tissues changed. Learn how to interpret fat mass, lean mass, hydration, DXA, BIA, strength and function in weight-loss research.

Public-health dashboards are time-stamped views of evolving records. Learn how provisional data, reporting lag, backfill, date fields, and revisions affect what you see.
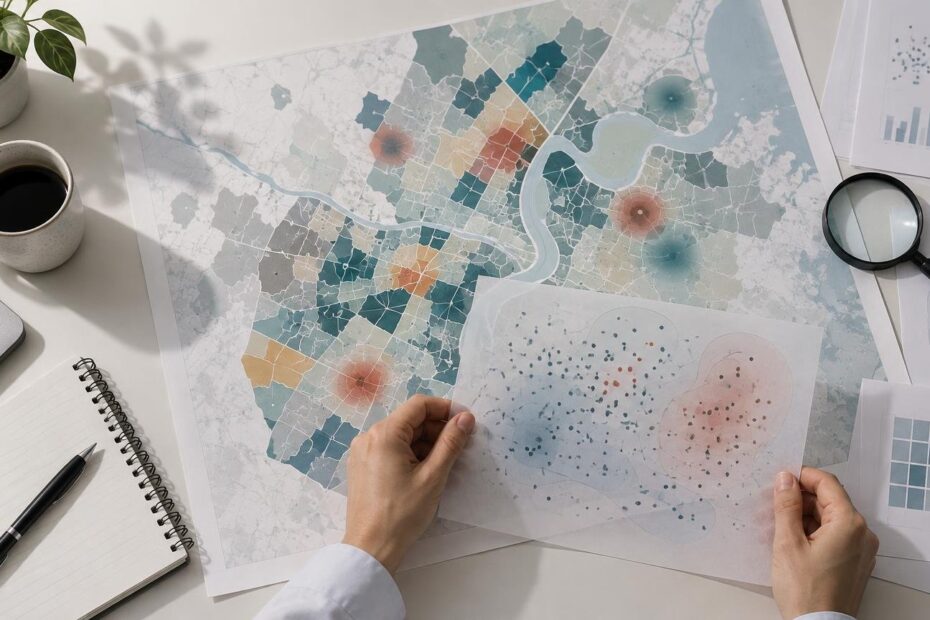
Small-area health maps can turn a few events into an apparent hotspot. Learn how sparse data, age adjustment, smoothing, geocoding, privacy controls, and ecological fallacy affect interpretation.
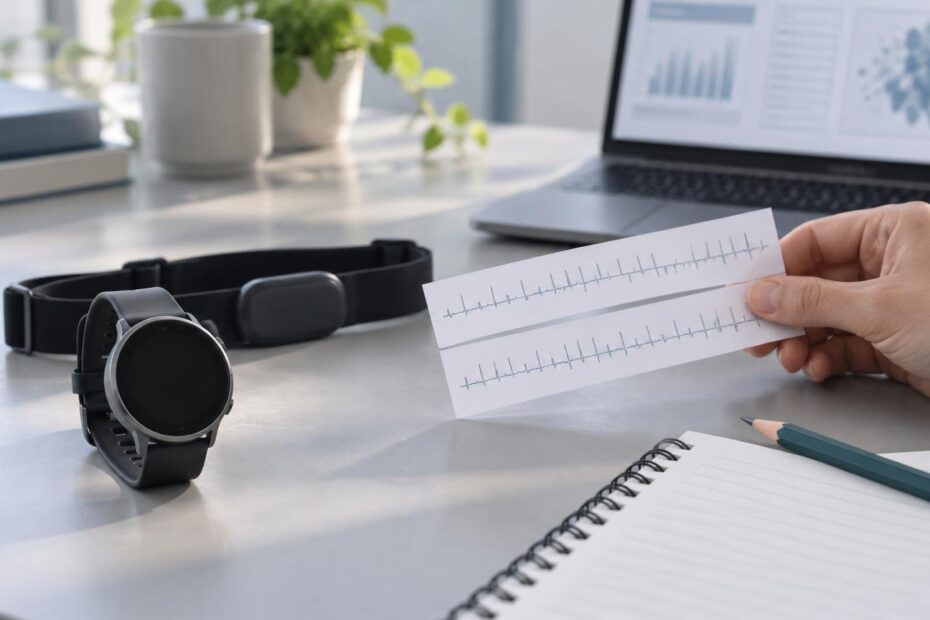
Wearable HRV can be useful for tracking personal trends, but the result depends on how pulse intervals are sensed, filtered, summarized, and collected.